G. M. Machado,
F. Sadlo,
T. Müller,
D. Müller,
T. Ertl:
In Proceedings of International Workshop on Vision, Modeling and Visualization (VMV),
pp. 95–102,
2012.
|
|

|
|
Abstract
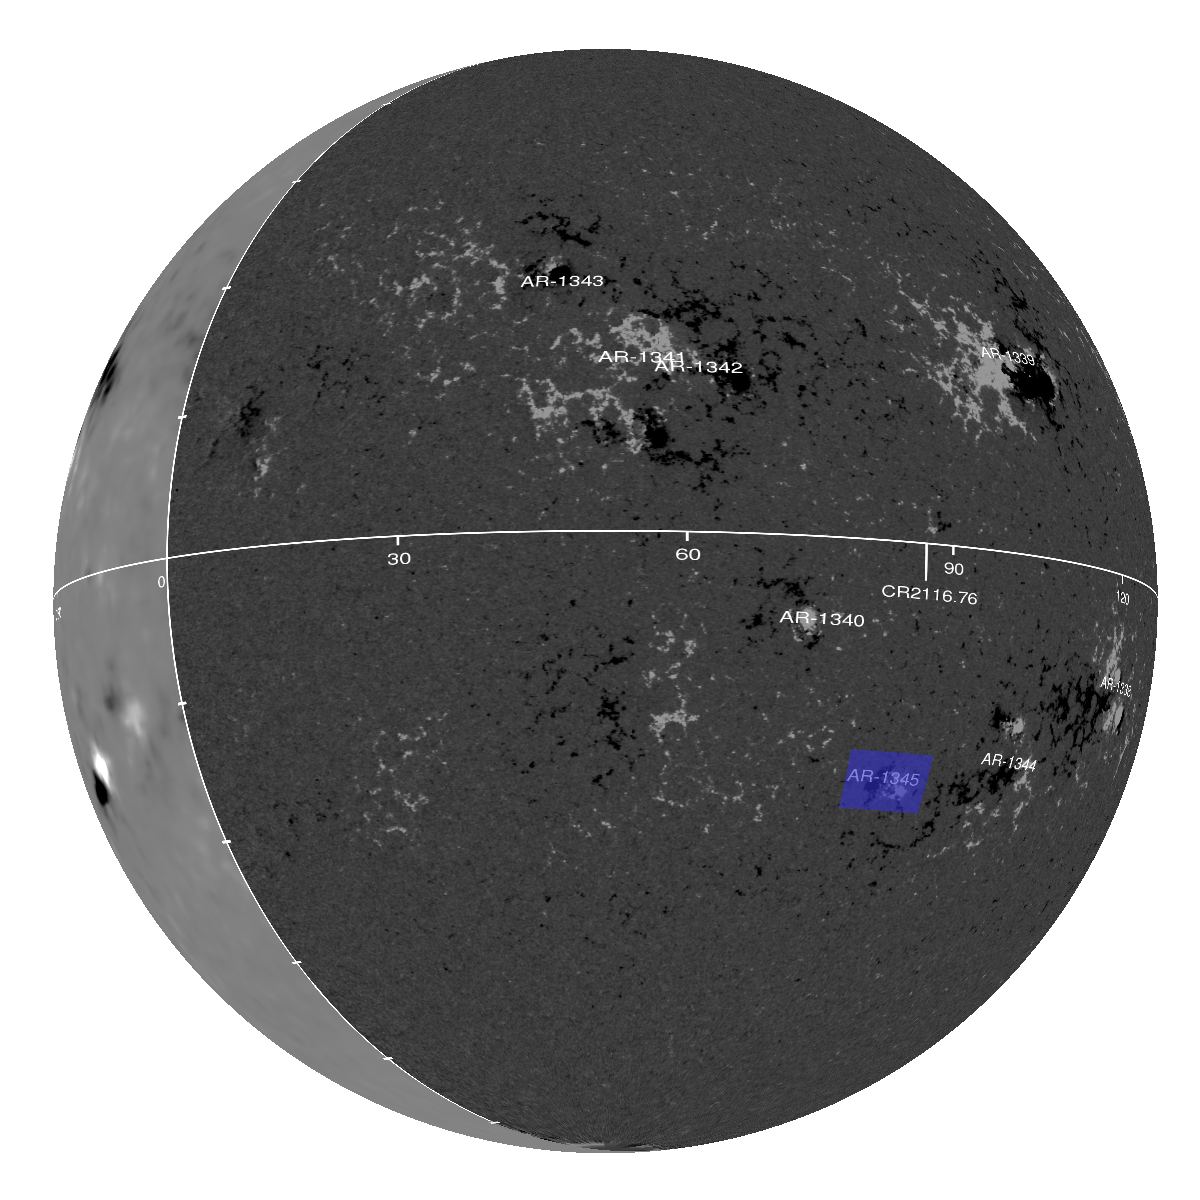
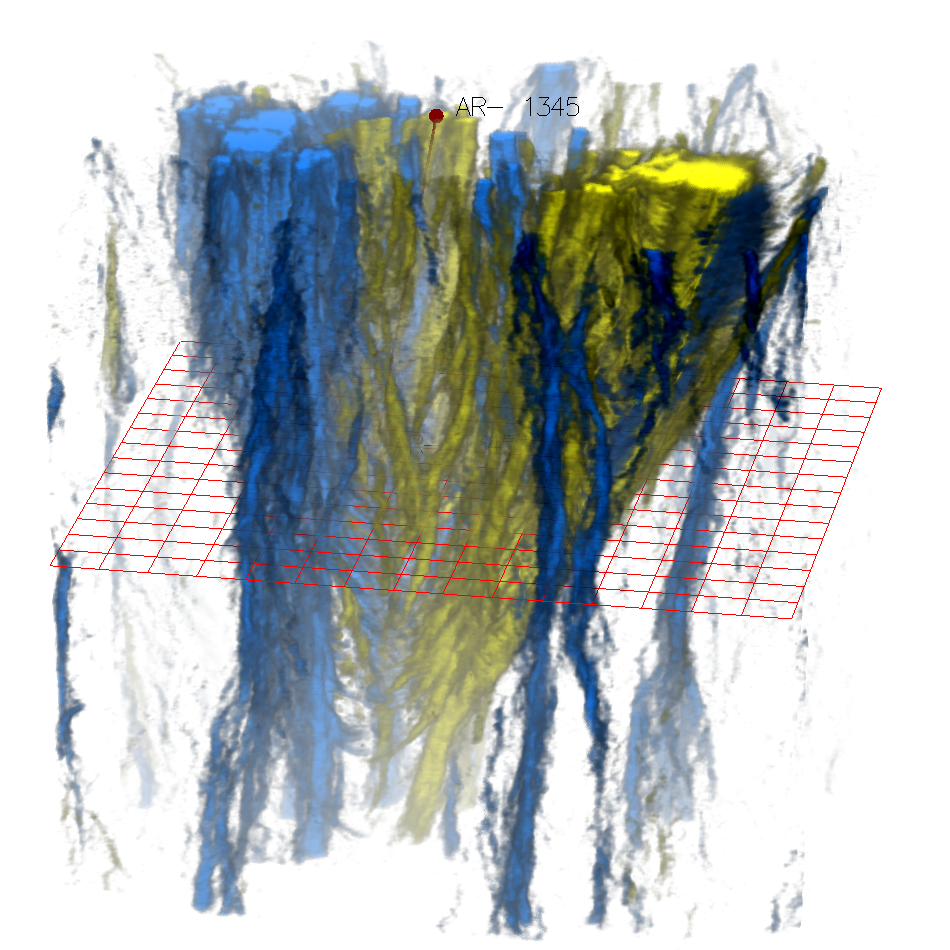
Solar dynamics data, particularly those from the Solar Dynamics Observatory, are now available in a sheer volume that is hard to investigate with traditional visualization tools, which mainly display 2D images. While the challenge of data access and browsing has been solved by web-based interfaces and efforts like the Helioviewer project, the approaches so far only provide 2D visualizations. We introduce the visualization of such data in the full 3D context, providing appropriate coordinate systems and projection techniques. We also apply and extend methods from volume rendering and flow visualization to 3D magnetic fields, which we derive from the sensor data in an interactive process, and introduce space-time visualization of photospheric data. Here, we concentrate on two solar phenomena: the structure and dynamics of coronal loops, and the development of the plasma convection in close vicinity of sunspots over time. Our approach avoids the time-coherence issue inherent in traditional magnetic field line placement, providing insight in the magnetic field and the structure of the coronal plasma. We are convinced that the presented techniques are applicable in many other fields such as the terrestrial magnetospheric physics, or magnetohydrodynamics simulations.
|
Available Files
[BibTeX]
[DOI]
[PDF]
[Technical Addendum]
[Video]
|
|