K. Scharnowski,
M. Krone,
F. Sadlo,
P. Beck,
J. Roth,
H.-R. Trebin,
T. Ertl:
IEEE Computer Graphics and Applications,
vol. 33,
no. 5,
pp. 9–17,
2013.

|
|
|
Abstract
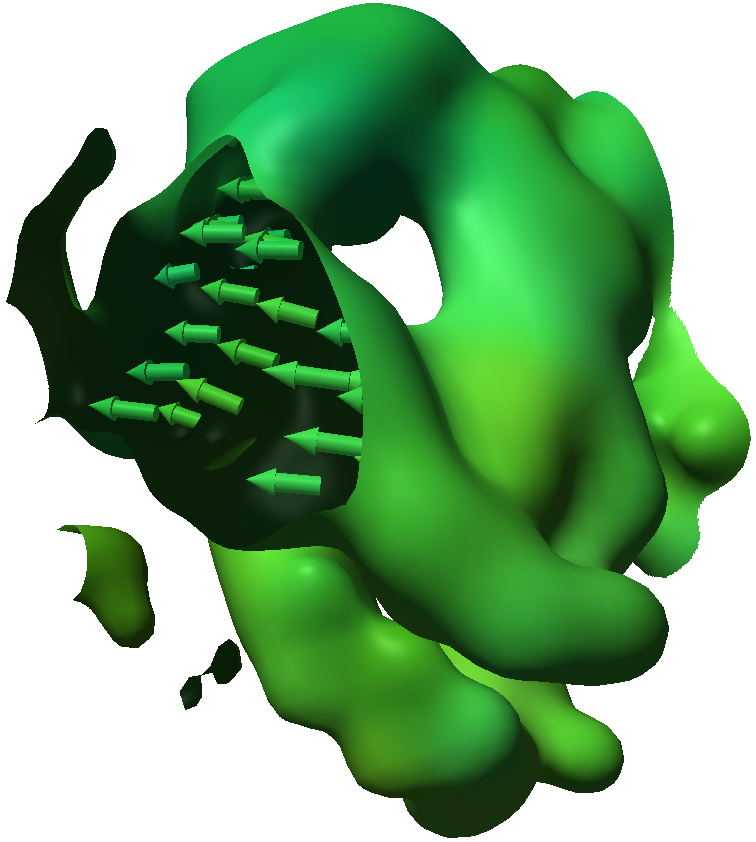
The winners of the 2012 IEEE Visualization Contest combined methods from molecular, flow, and scalar data visualization to reveal the characteristics and processes in the contest data. Because the simulated material didn't behave according to theory from textbooks, one challenge was to find meaningful visualizations to facilitate exploratory analysis. The contest winners created an interactive visual-analysis application based on MegaMol, their visualization framework. The tailored visualizations revealed data characteristics such as thermal vibrations and the spatial distribution of polarization domains. Domain expert knowledge verified the results. This video at http://youtu.be/RXnNKekY7VE shows the dataset used and the development of vector clusters over time.
|
Available Files
[BibTeX]
[DOI]
|
|